
Guido Grandi1671–1742
Named the rose curves, 1723
Italian monk, priest and mathematician at Pisa who studied the rose curves in the 1720s and named them rhodonea, and who wrote on the series 1 − 1 + 1 − 1 + … that still bears his name.
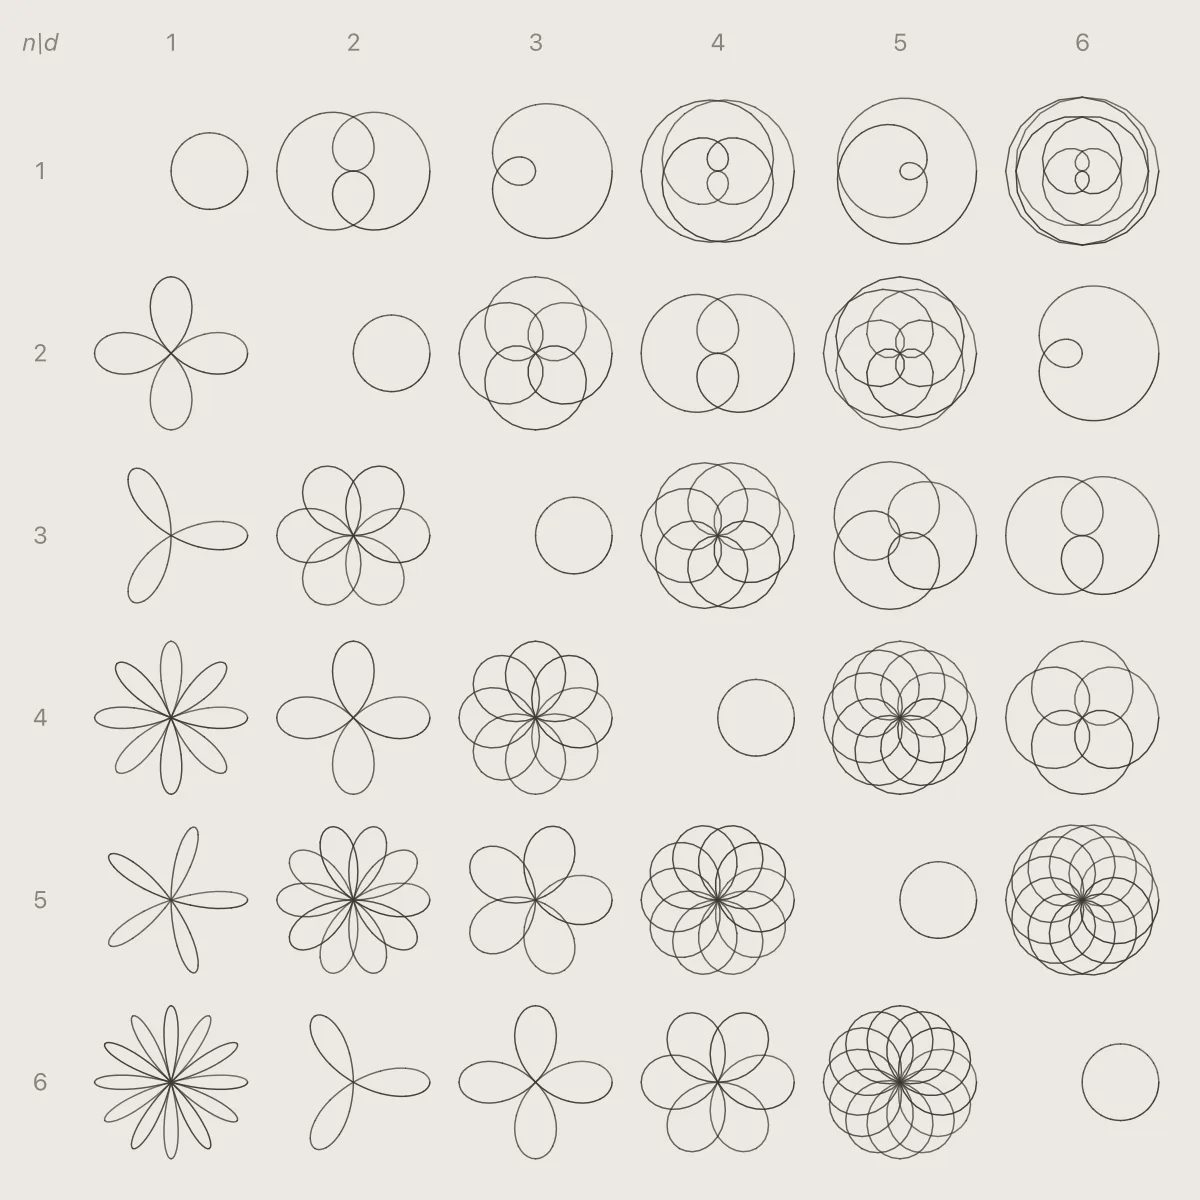
Plot r = cos(kθ). Whole numbers give flowers of petals; fractions wind round and round into lace. Laid out as a table, n down and d across.
Guido Grandi, 1723
In polar coordinates a point is a distance and a direction: how far out from the centre, and at what angle. Let the distance be the cosine of a multiple of the angle, r = cos(kθ), and as the angle sweeps round, the point swings out and back again, each swing a petal. The Italian priest and mathematician Guido Grandi studied these curves around 1723 and named them rhodonea, roses.
With a whole number k the count is easy to predict, and puzzling at first: k petals when k is odd, but 2k when it is even, because an odd rose traces every petal twice over, once forwards and once with the radius negative, and an even one does not. Make k a fraction n/d and the curve no longer closes after one turn: it winds round d times, or 2d, before it meets itself, and the petals overlap into lace.
The table lays out n down and d across, the way it is drawn in textbooks and graphing lessons, so the patterns can be read off: along the diagonal every k is 1 and the rose is a single circle, and each row and column has its own family of shapes. Turn the polar grid on for the graph-paper look of a graphing calculator.
In motion the pen goes round the rose once, and its arm shows the angle and the distance at every moment.
Behind the mathematics
Named the rose curves, 1723
Italian monk, priest and mathematician at Pisa who studied the rose curves in the 1720s and named them rhodonea, and who wrote on the series 1 − 1 + 1 − 1 + … that still bears his name.