
Jocelyn Bell Burnellborn 1943
Found the first pulsar, CP 1919, in 1967
Northern Irish astrophysicist who, as a research student at Cambridge in 1967, noticed the regular pulses of the first known pulsar in the charts of a new radio telescope.
Eighty radio pulses from a spinning star, stacked one above the next, each hiding the ones behind it. A chart from a 1970 thesis that became a landscape.
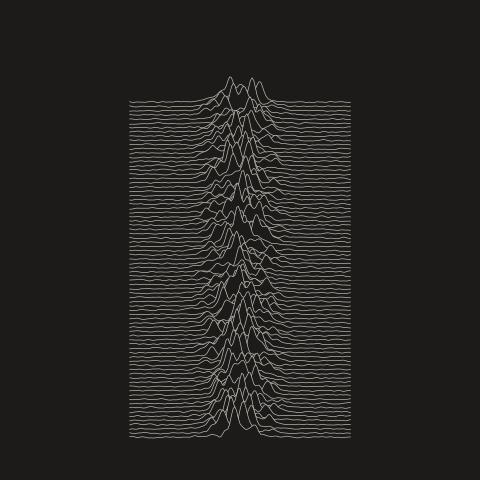
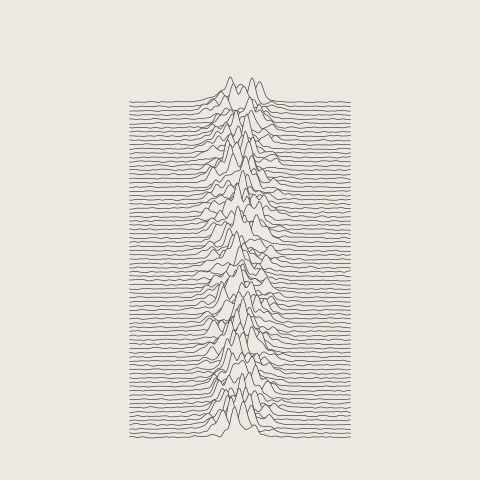
Jocelyn Bell Burnell, 1967 · Harold Craft, 1970
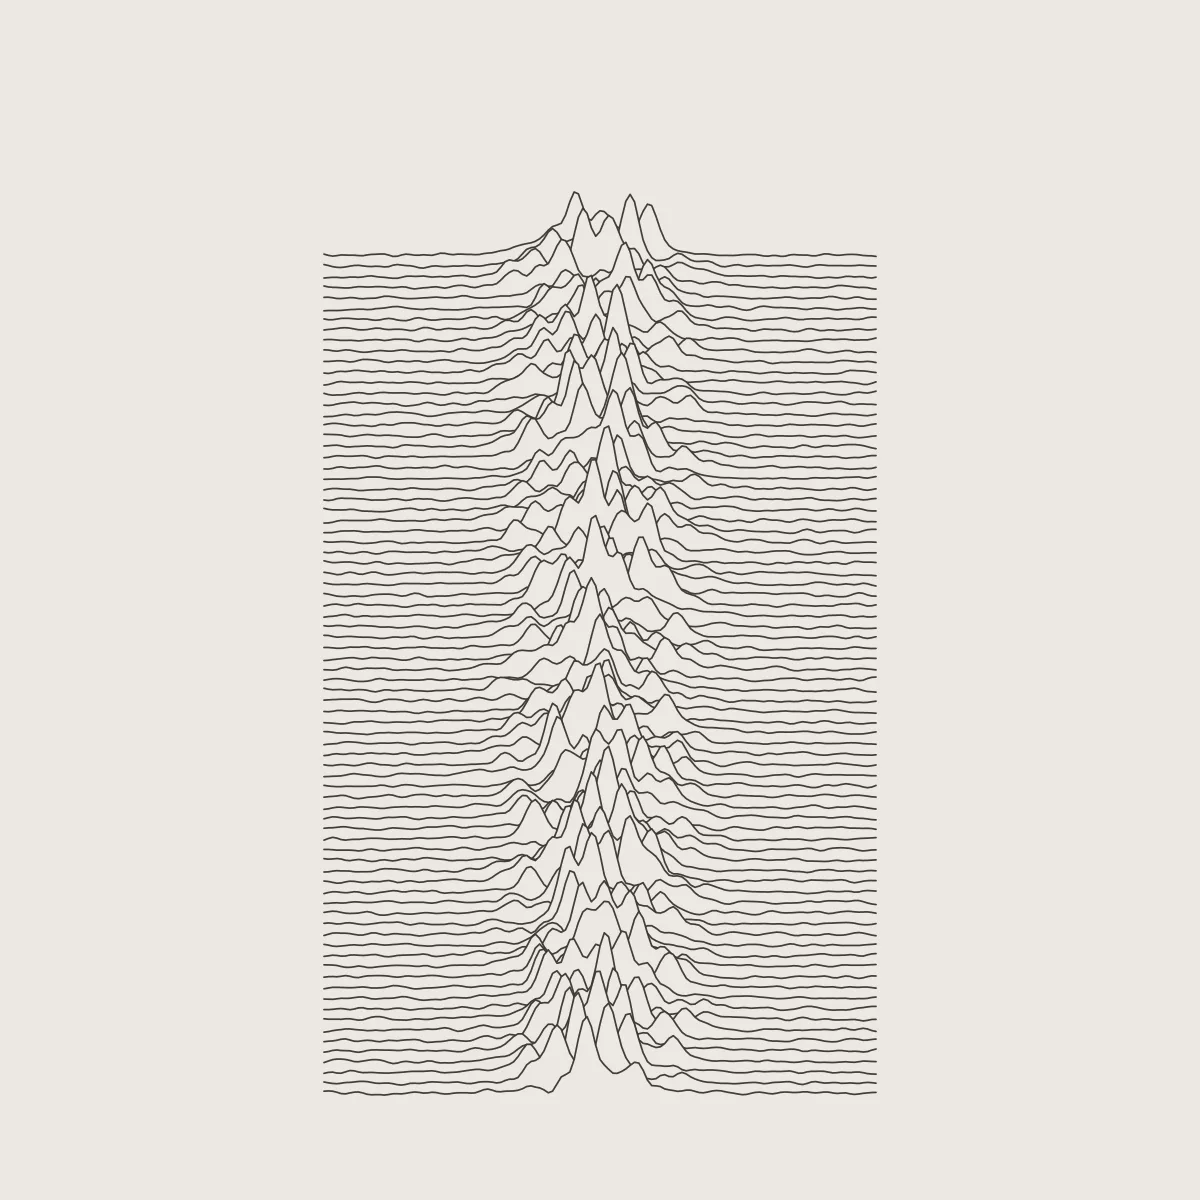
In November 1967 Jocelyn Bell Burnell, a research student at Cambridge, noticed a bit of scruff on the chart paper of a new radio telescope: a pulse every 1.337 seconds, so regular that it was nicknamed LGM-1, for little green men. It was the first pulsar, a collapsed star twenty kilometres across, turning on its axis and sweeping a beam of radio waves past the Earth like a lighthouse.
Harold Craft, working on his doctorate at Cornell with the great dish at Arecibo, drew eighty pulses of it, now called CP 1919, one above another. To keep the stack readable, each line hides whatever lies behind it, and the chart turns into mountains seen from the air. It was copied into books and encyclopedias, and in 1979 it became the cover of Joy Division's first album, Unknown Pleasures, one of the best-known images in graphic design.
The pulses here are made up, not recorded, but they follow the real ones: noise everywhere except a narrow window, where a few sharp subpulses rise under a bell-shaped envelope, and from one turn to the next the subpulses drift across the window, as CP 1919's do.
In motion a new pulse arrives at the front every 1.34 seconds when there are eighty of them, the pulsar's own beat, and the oldest slips away at the back.
Behind the mathematics
Found the first pulsar, CP 1919, in 1967
Northern Irish astrophysicist who, as a research student at Cambridge in 1967, noticed the regular pulses of the first known pulsar in the charts of a new radio telescope.
Stacked its pulses into the plot, 1970
American radio astronomer who studied pulsars with the Arecibo telescope for his Cornell doctorate. The stacked plot of 80 pulses in his 1970 thesis became one of the best-known images in graphic design.